Mobile game KPIs: which metrics to track and why
 By Mike Dalton ·
Mobile game KPIs are the few metrics that show whether players come back, how much they play, how far they get, and whether the game earns more than it costs. They fall into five groups: retention, engagement, gameplay, monetization, and acquisition. This guide gives the formula for each one, the details that change it, and which ones to watch at each stage of a game.
| Metric | Formula | What it tells you |
|---|---|---|
| D1, D7, D30 retention | Players in a cohort active on day N / players in the cohort | Whether new players come back |
| Daily active players (DAU) | Distinct players active on a day | How many people play each day |
| Monthly active players (MAU) | Distinct players active in the 30 days ending on a day | How many people play in a month |
| Stickiness | DAU / MAU | How often a monthly player plays |
| Session length | Total session time / sessions | How long one sitting lasts |
| Sessions per player | Sessions on a day / DAU | How often players open the game in a day |
| Level completion rate | Attempts finished / attempts started | Where players get stuck |
| Win rate | Matches won / matches played | Whether a character or map is balanced |
| ARPDAU | Revenue on a day / DAU | How much the game earns per player per day |
| Payer conversion | Paying players / active players | What share of players pay |
| ARPPU | Revenue / paying players | How much a paying player spends |
| LTV | Revenue from a player over their whole time in the game | How much a player is worth |
| CPI | Ad spend / installs from that spend | How much a new player costs |
Retention metrics
Retention is the share of new players who play again a given number of days after their first day. Players whose first day was the same day form a cohort.
- D1 retention is the share of a cohort that played on the day after their first day.
- D7 retention is the share that played on day 7.
- D30 retention is the share that played on day 30.
Churn is the opposite question: the share of players who stopped playing. A game with low D1 retention loses most new players after the first session, so fix D1 before you look closely at D30.
Tools calculate retention in different ways. Classic retention counts a player who played on exactly day N, and rolling retention counts a player who played on day N or any later day, so the same data gives two different numbers. How to measure game retention covers both definitions, a SQL query that calculates D1, D7, and D30, and published benchmarks for mobile and PC games.
Engagement metrics
Engagement metrics show how many players you have and how often they play.
Daily active players (DAU) is the number of distinct players who played on a day. Monthly active players (MAU) is the number of distinct players who played in a month. MAU can mean a calendar month or the 30 days ending on a given day. The 30-day window gives a value for every day, so you can compare MAU from one day to the next and divide DAU by it.
Stickiness is DAU / MAU. It shows how many days a month a typical monthly player plays. If 2,000 players played in the last 30 days and 400 of them played today, stickiness is 400 / 2,000 = 20%, which means a monthly player plays on about 6 of 30 days. A game that players open every day has a high stickiness, and a game that players try once has a low one. DAU/MAU for games shows how to calculate it with SQL and what changes it.
For the first 30 days after launch, MAU only counts the players since launch, so stickiness starts at 100% on the first day and falls as the window fills. Compare stickiness only for days at least 30 days after launch.
Session length is the average duration of one session, and sessions per player is the average number of sessions each active player has in a day. Both depend on how a session ends: when the player closes the game, after a period in the background, or when your game sends a session end event. Check the definition before you compare your numbers with a benchmark. Daily playtime combines the two: the total time an active player spends in the game in a day.
The GameAnalytics 2026 benchmarks report these values for more than 16,000 mobile games during 2025:
| Mobile games | Session length | Sessions per day | Daily playtime |
|---|---|---|---|
| Median | 3.1 to 3.5 minutes | 3.8 to 3.9 | about 12 minutes |
| Top 25% | about 5.2 minutes | 5.3 to 5.7 | 22 to 24 minutes |
| Top 10% | just over 8 minutes | about 9.6 | 40 to 42 minutes |
The same report publishes DAU / MAU for PC games only: a median of 4% to 5%, about 7% for the top 25%, and 13% to 15% for the top 10%.
Gameplay metrics
Retention and engagement tell you that players leave. Gameplay metrics tell you where and why, and they are the metrics that general app analytics does not cover.
- Tutorial completion is the share of new players who finish the tutorial. Track each step, so you can see which step players stop at.
- Level completion rate is the share of attempts at a level that players finish. A level with a much lower rate than the levels around it is where players get stuck, and often where they stop playing. How to find which levels players get stuck on shows how to measure it and check a fix.
- Win rate and pick rate matter for competitive games. A character, deck, or map that wins far more than the others makes matches feel decided before they start. How to balance a game with data covers both metrics and how many matches you need before you trust them.
- Achievement unlock rate is the share of players who unlocked an achievement. It shows how far players get and which goals they pursue.
Monetization metrics
Monetization metrics show how much the game earns and from whom. ARPDAU, ARPPU, and ARPU for games works through all three with one example and a SQL query.
- ARPDAU (average revenue per daily active user) is revenue on a day / DAU. Include ad revenue if the game shows ads.
- Payer conversion is the share of active players who made a purchase in a period: paying players / active players.
- ARPPU (average revenue per paying user) is revenue / paying players in the same period. Low conversion with a high ARPPU means a few players pay a lot.
- LTV (lifetime value) is the total revenue a player brings over their whole time in the game. For players who are still playing, LTV is a prediction based on retention and ARPDAU, so the value depends on the model that calculates it.
Acquisition metrics
Acquisition metrics matter when you pay for installs. CPI (cost per install) is ad spend / installs from that spend. ROAS (return on ad spend) is the revenue from the players you acquired / the ad spend. Paid acquisition pays for itself only when LTV is higher than CPI.
Which KPIs to watch first
You do not need every metric at every stage.
- Before soft launch: D1 retention, tutorial completion, and the completion rate of the first levels. They show whether new players understand the game and want to play again.
- Soft launch: D1 and D7 retention, stickiness, and payer conversion, measured on a small market before you spend on acquisition.
- After launch: D30 retention, ARPDAU, and LTV compared with CPI.
At every stage, compare each new version and each new cohort with the ones before it. Benchmarks mix many genres, so they show whether a number is in a reasonable range. Your own earlier versions show whether a change helped.
Track mobile game KPIs in Game Stats AI
To show what that looks like, we used the example competitive game from the retention guide: new players joined every day for eight weeks, and every match was sent to the matches endpoint.
A retention report counts a player as active on any day they play a match, send an event, unlock an achievement, or record a progression event. It charts daily, weekly, and monthly active players and shows the averages for D1, D7, and D30 retention, DAU, WAU, MAU, and stickiness:
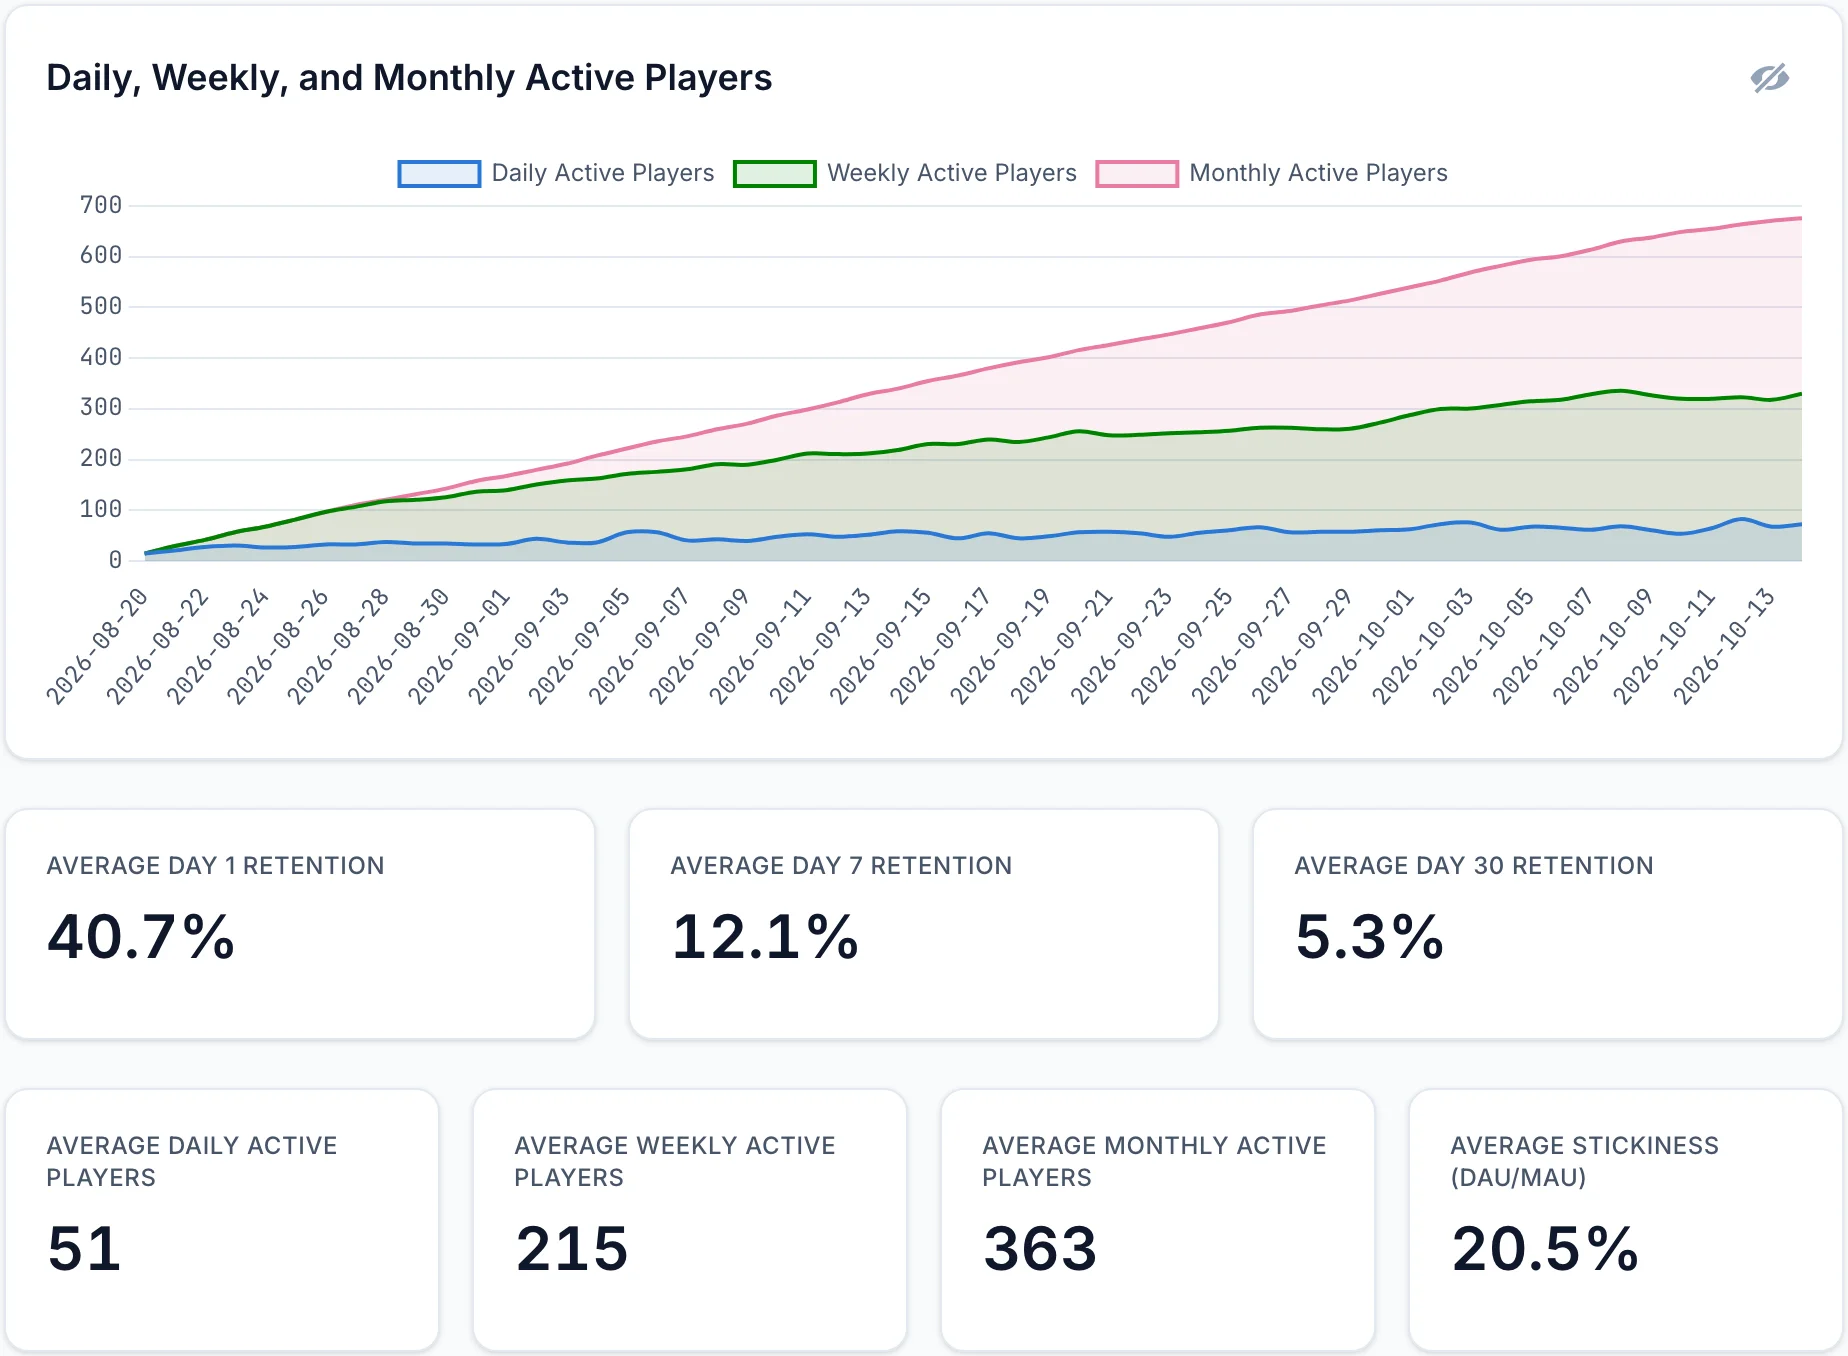
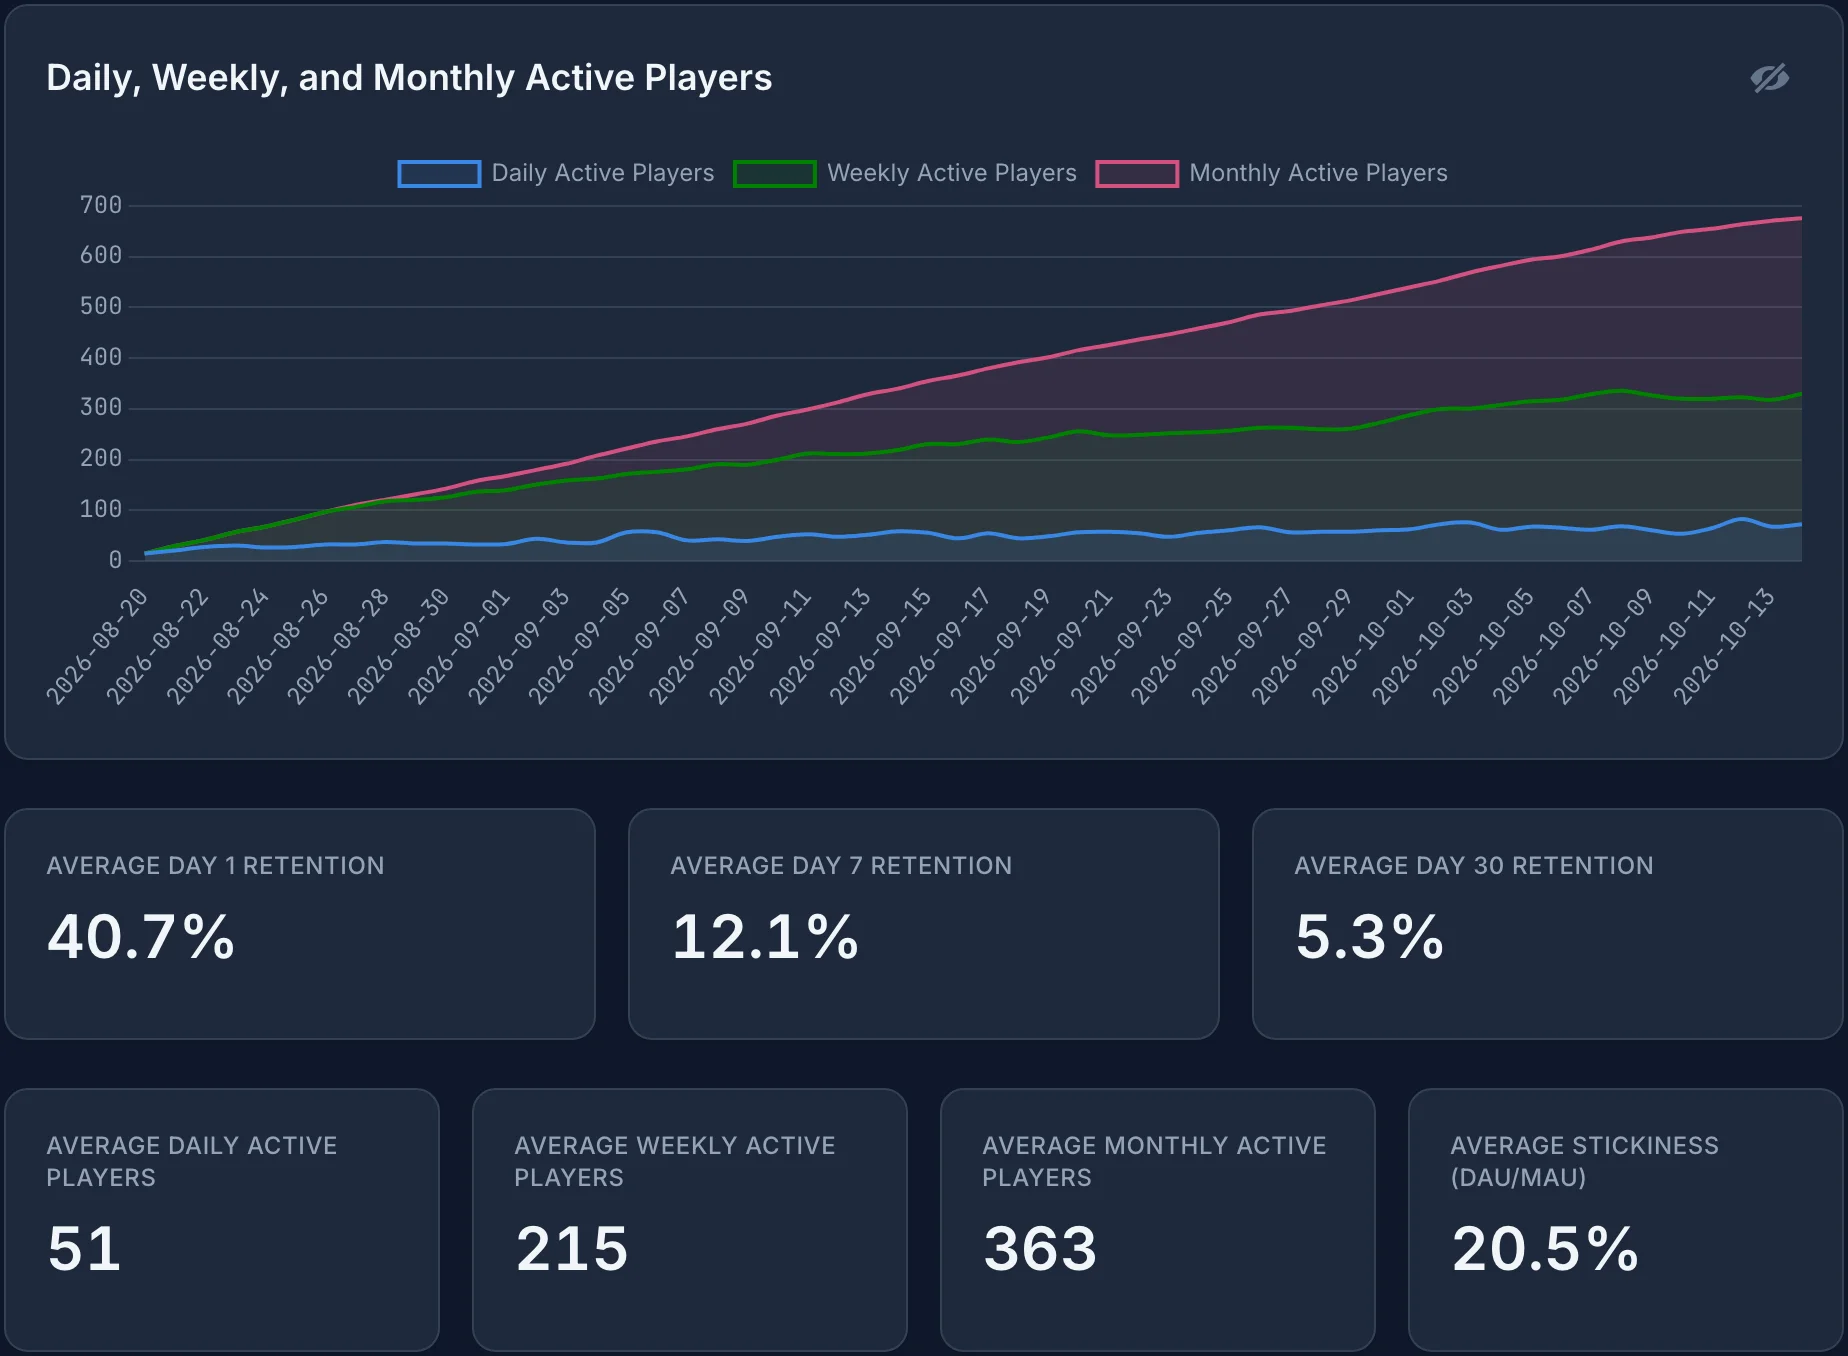
The example game launched eight weeks before this screenshot, so the average stickiness of 20.5% includes the first 30 days, when MAU only counted the players since launch. On the last day, 73 of 676 monthly active players played, a stickiness of 10.8%. For the last 30 days, the average stickiness is 11.8%. To leave out the launch, choose a date range that starts at least 30 days after it.
For session length and playtime, we added generated session start and end events to the same game: one session around each match, a shorter second session on about a third of the days a player played, and about 3% of sessions that never send their end event. A session report reads either one event per session with its duration, or session start and end events. It charts session length and daily playtime, shows the averages for daily sessions, session length, sessions per player, and daily playtime, and counts sessions by length:
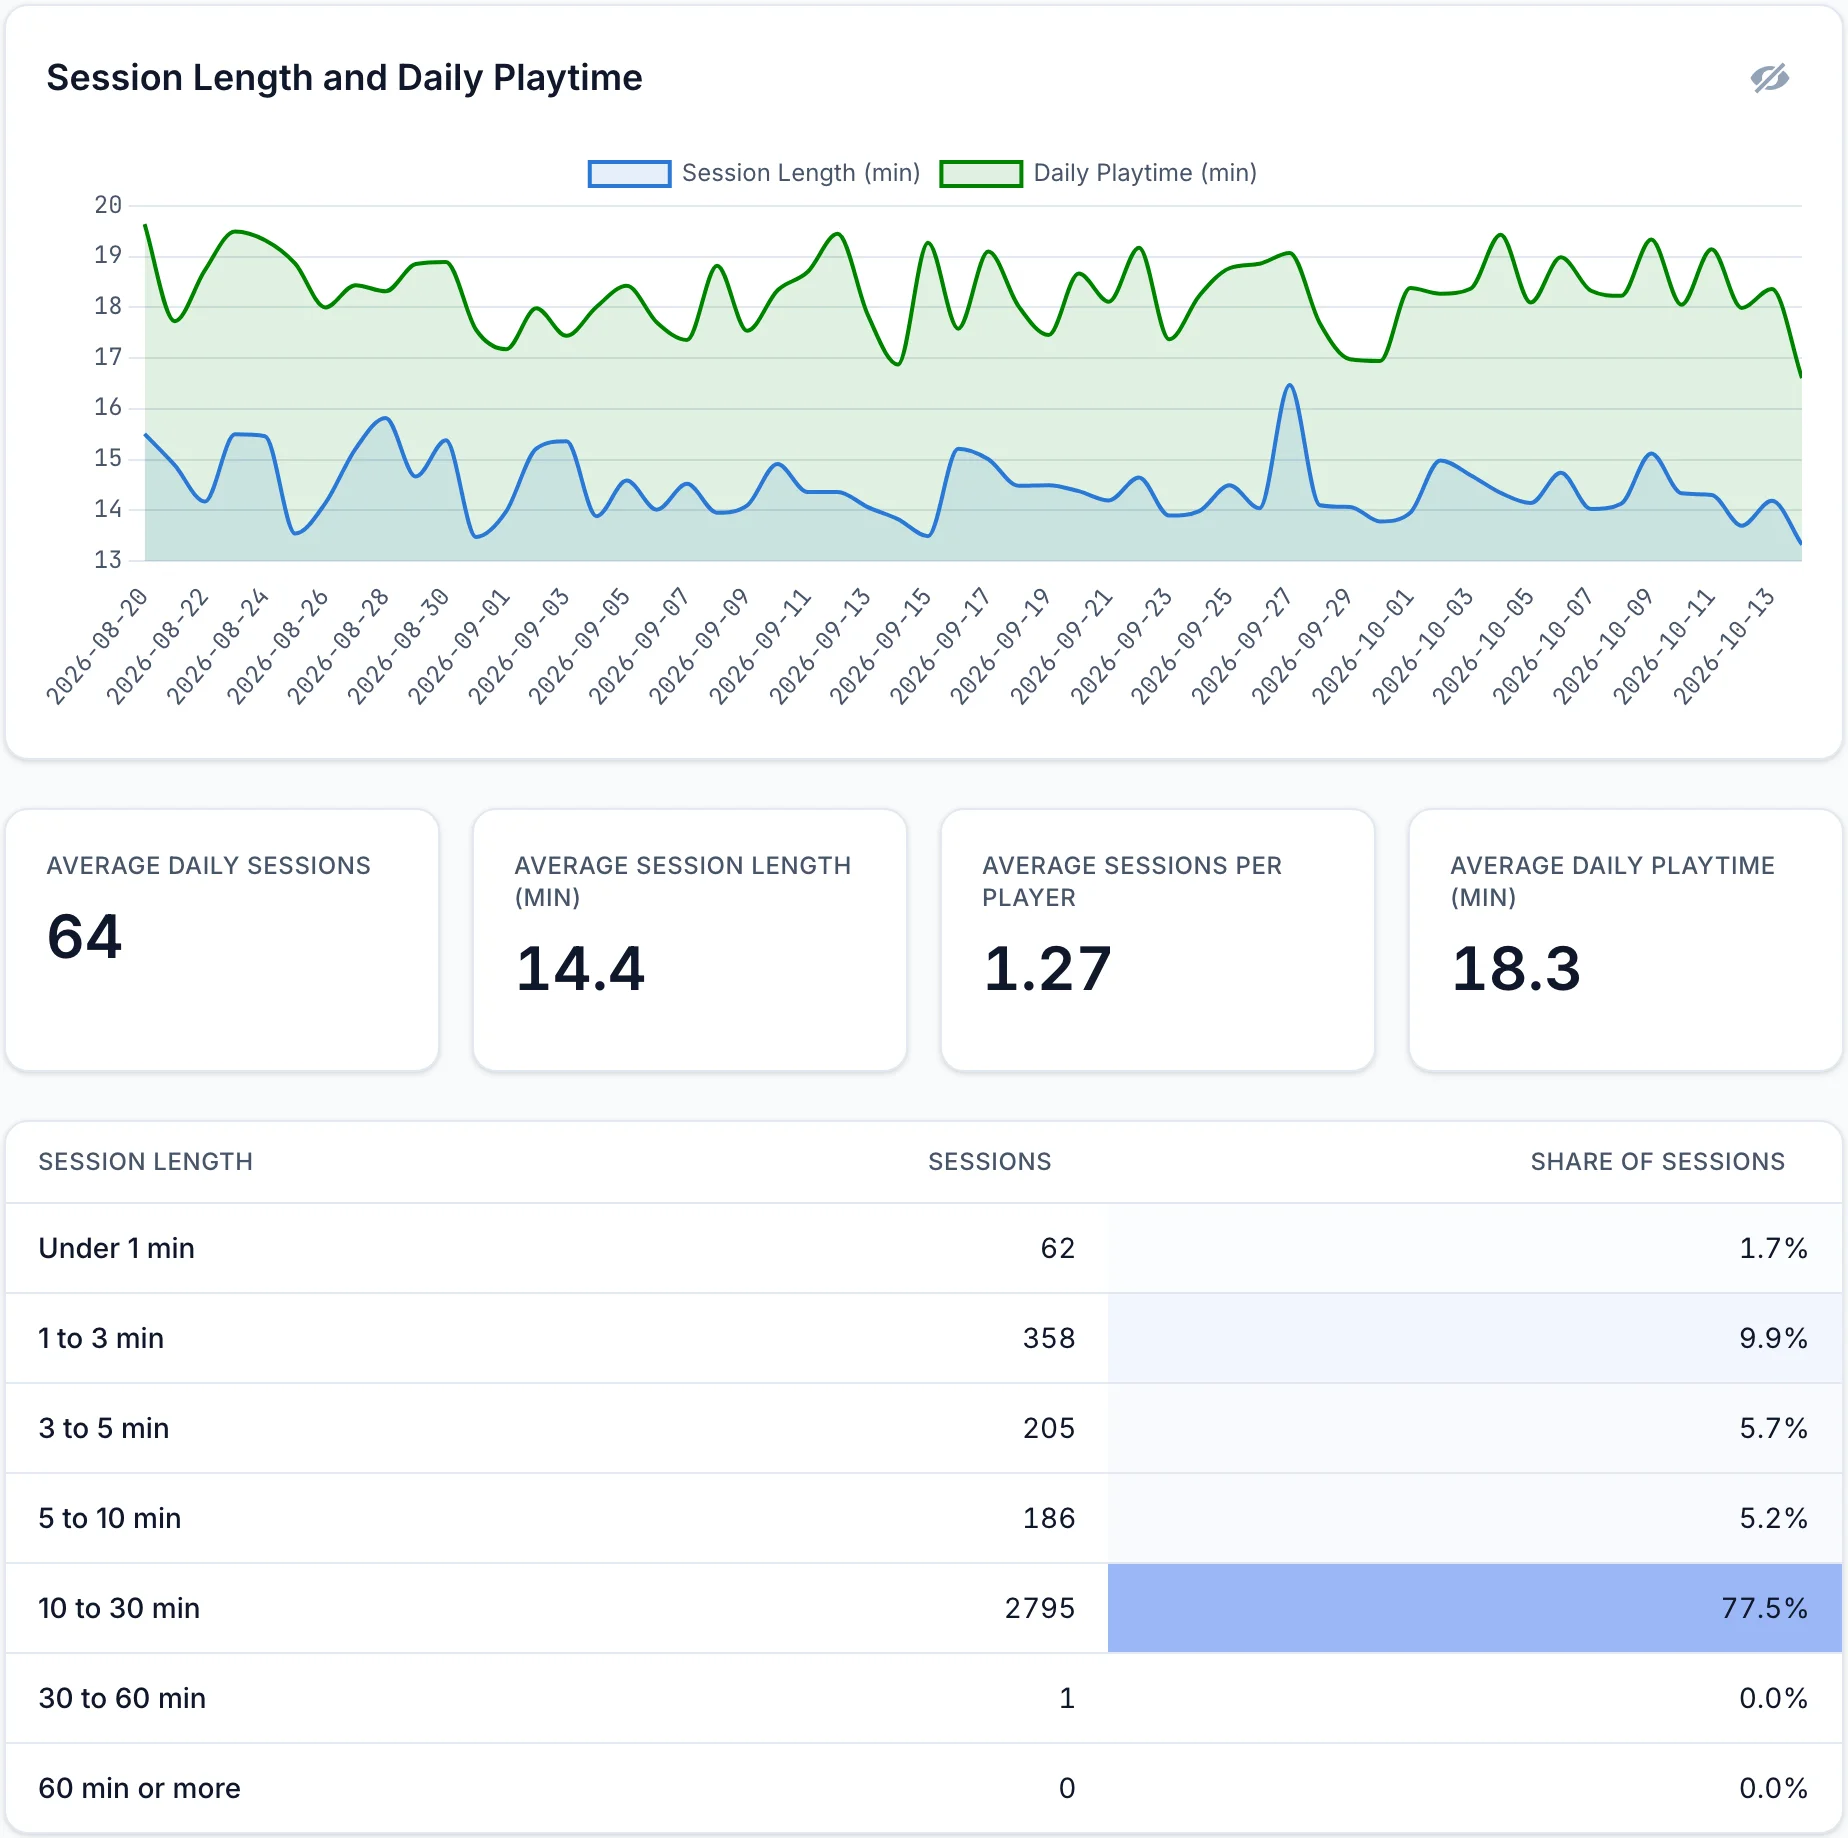
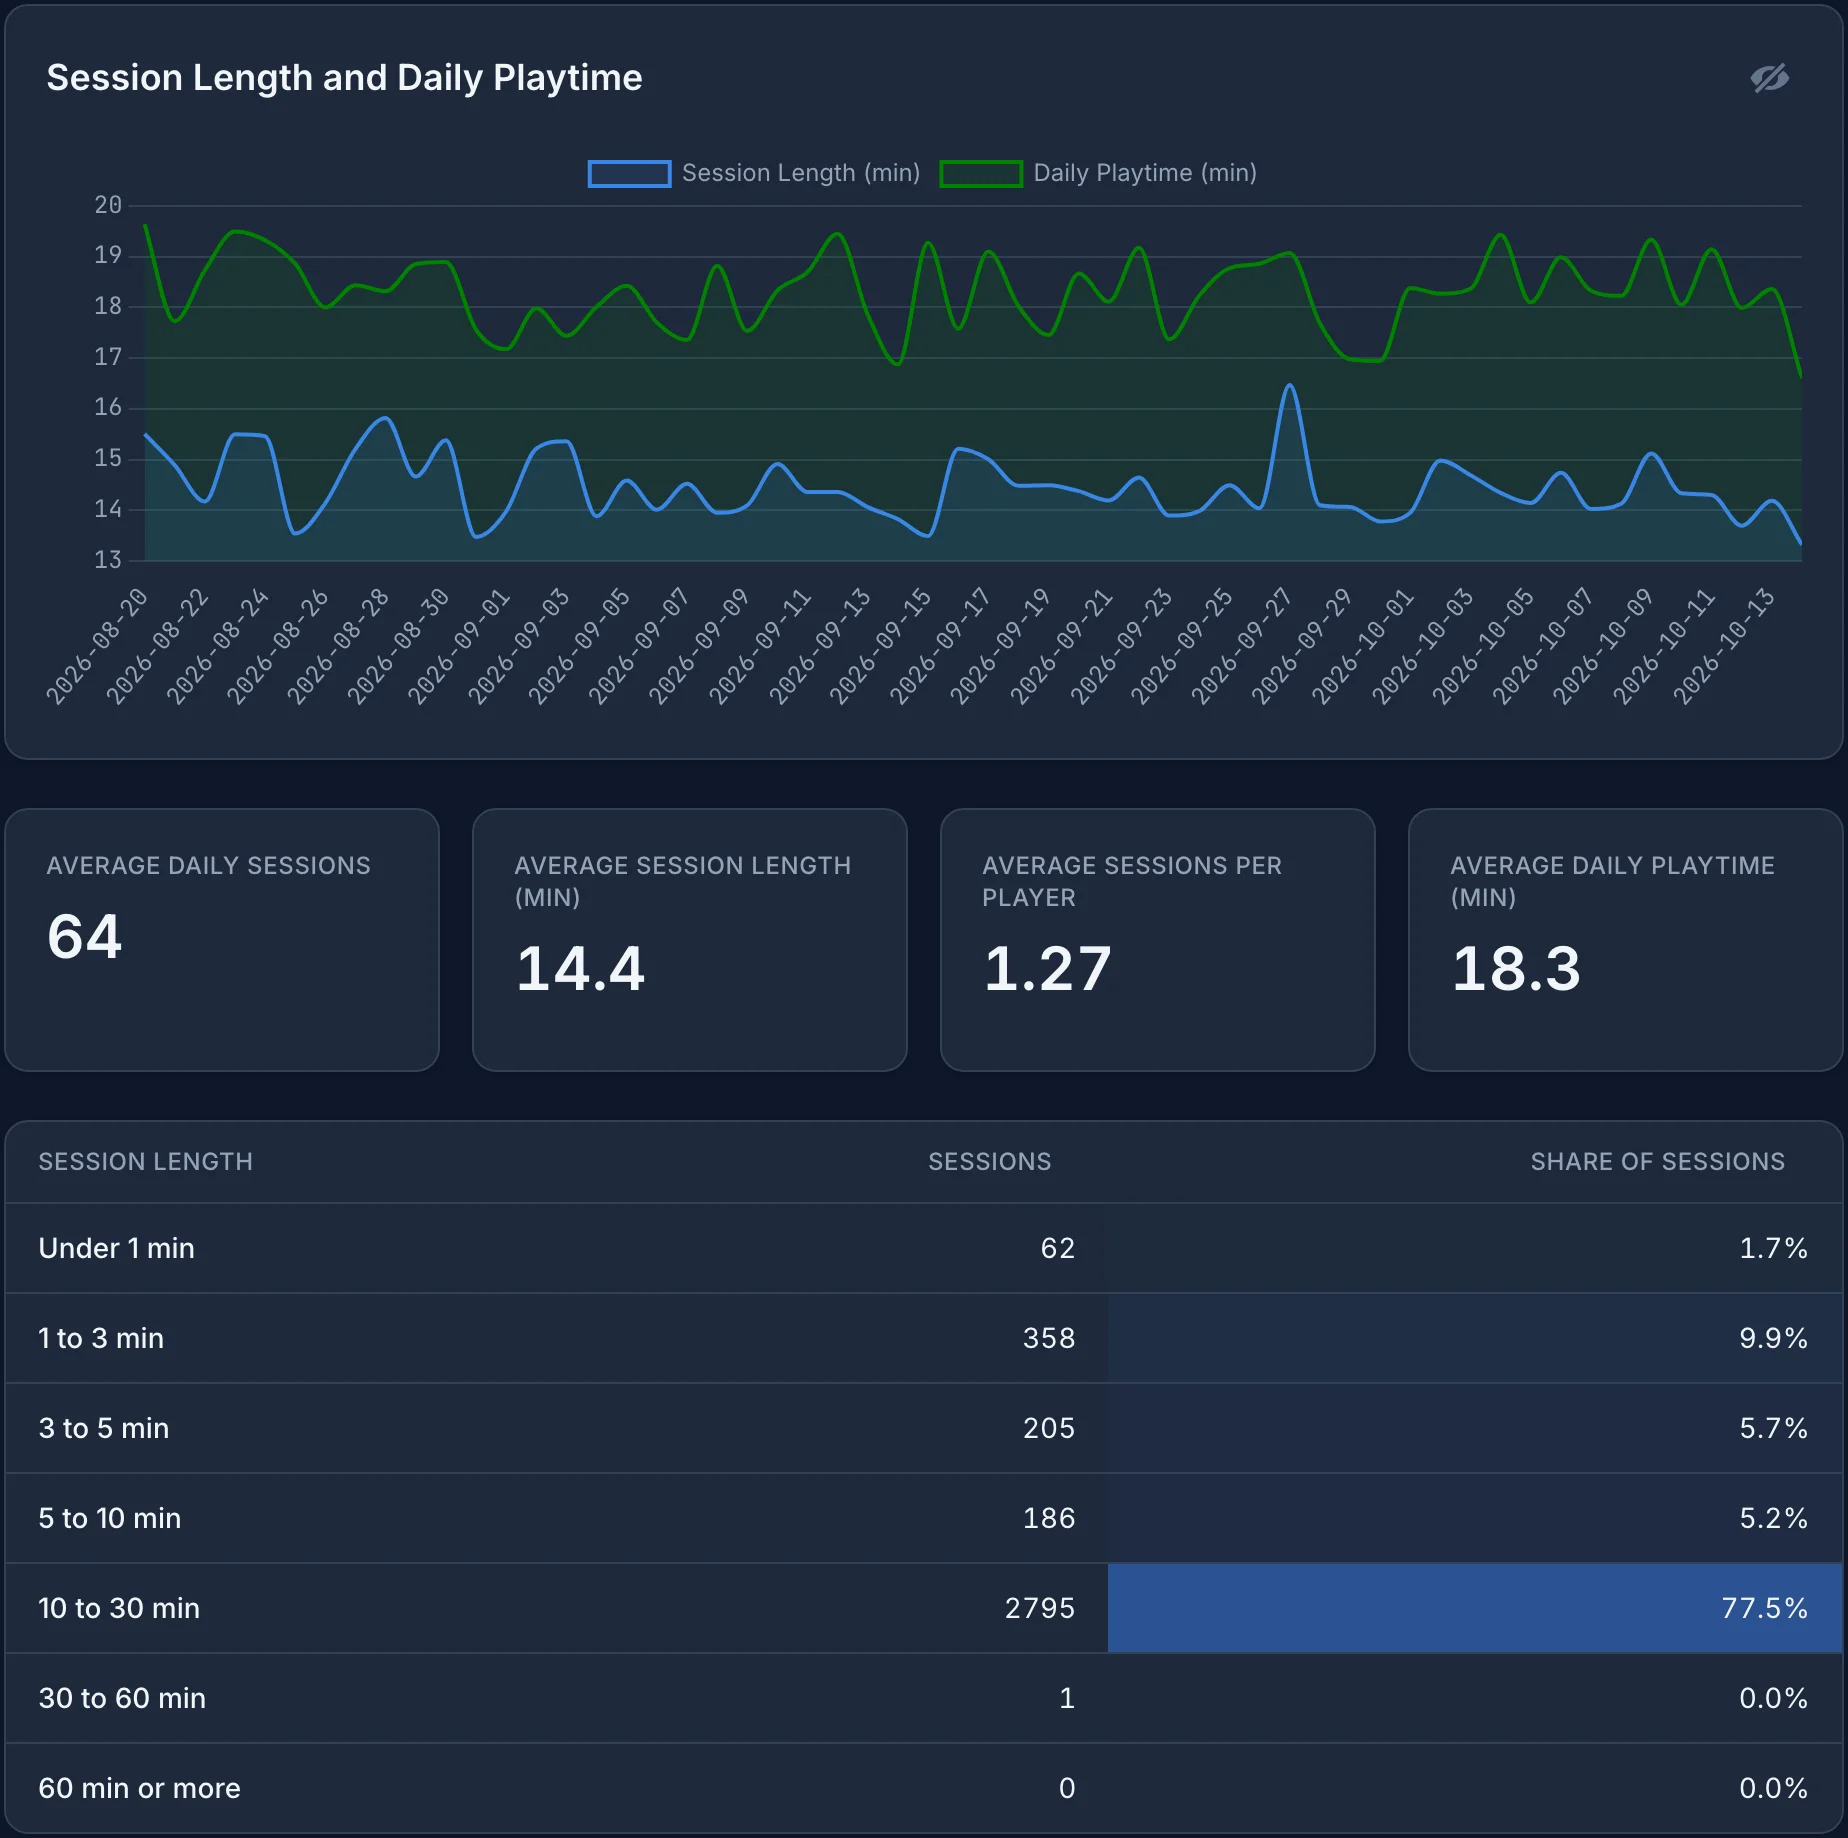
Every main session in the example game contains a match, so 77.5% of sessions last 10 to 30 minutes and the average session is 14.4 minutes, longer than the top 10% of mobile games in the benchmarks above. That is normal for a competitive match-based game, and it is why you should compare session length with your own earlier versions rather than with a benchmark from another genre.
For gameplay metrics, a progression report shows the completion rate of each level or tutorial step, an achievement report shows the share of players who unlocked each achievement, and the match reports show win rate by character or map.
A revenue report calculates ARPDAU, payer conversion, ARPPU, and ARPU by day 1, 7, and 30 from the purchase, ad, and other revenue events your game sends, in US dollars. Game Stats AI does not report predicted LTV or acquisition metrics. For those, use a tool from the best game analytics tools, or use one alongside Game Stats AI. You can also ask Claude about your data through MCP, for example What was our stickiness last week?
Frequently asked questions
What are the most important KPIs for a mobile game?
D1 retention first, because it shows whether new players come back after their first session. After that, D7 and D30 retention, stickiness, and, for a game that earns money, ARPDAU and LTV compared with CPI.
What is a good DAU/MAU ratio?
It depends on the genre and the type of game. GameAnalytics does not publish a DAU / MAU benchmark for mobile games. For PC games in 2025, the median was 4% to 5% and the top 10% reached 13% to 15%. Compare your stickiness with your own earlier months, and only for days at least 30 days after launch. DAU/MAU for games explains what changes the ratio.
What is the difference between a metric and a KPI?
A metric is any number you can measure, such as the number of matches played. A KPI (key performance indicator) is one of the few metrics you choose to judge whether the game is doing well, such as D1 retention.
What is ARPDAU?
ARPDAU is average revenue per daily active user: the revenue on a day divided by the number of players who played that day. If 1,000 players played on a day and the game earned $50 from purchases and ads, ARPDAU is $0.05. ARPDAU, ARPPU, and ARPU for games compares it with ARPPU and ARPU.